iPhone User Statistics

iPhone User Statistics – Introduction
Few products in tech history have had as transformative an impact as the iPhone. Apple started a mobile revolution with the introduction of the first iPhone back in 2007. Today, over a decade and a half later, the iPhone isn’t just a device; it’s a phenomenon. It has sold more than 2.32 billion units to date and yet continues to hold an immense appeal with consumers worldwide.
Let’s paint a clearer picture. Within the first half of 2023 alone, Apple shipped a staggering 97.7 million iPhone units. Hold on to your hats as there’s more! Apple continues to dominate the smartphone industry, boasting an impressive 27.67% share of the global smartphone market. Sixteen years after the release of its first smartphone model, the company once again managed to create a buzz with its highly anticipated iPhone 15 series.
Now, for the marketers and enthusiasts out there who understand the weight of these figures, we’ve got a treat. With this post, we dive deep into the most intriguing iPhone statistics that might be of interest. And yes, iPhone 15 enthusiasts, we’ve dedicated an entire section just for you!
| Key Facts at a Glance | |
|---|---|
| Global iPhone Users (2023): | An estimated 1.36 billion people, or about 19% of the world’s population, are devoted iPhone users. |
| iPhone Users in the US (2023): | A robust figure of 136 million, which equates to around half of the American population. |
| Market Dominance: | Apple reigns supreme over the global smartphone market with a share of 27.67% as of January 2023, closely followed by Samsung with a 27.15% share. Apple’s dominance is even more pronounced in the US where the company has claimed a whopping 57.59% market share. |
| Apple’s Lifeline: | Did you know that the iPhone isn’t just popular among users, but is also Apple’s primary revenue source? Yes, it accounts for a jaw-dropping 50% of Apple’s total global sales. |
The trajectory of the iPhone’s growth and its impact on Apple’s value in the global market is nothing short of impressive. From crossing the billion-user threshold in 2020 to consistently elevating its user base year-on-year, the iPhone’s story is one of triumph, innovation, and unmatched allure.
Historical Overview – The Evolution of iPhone
In the history of technological innovation, very few products stand out as distinctively as the iPhone. When Steve Jobs, with his characteristic showmanship, introduced a 3-in-1 device in 2007 to the world, the landscape of mobile communication transformed forever. This innovative gadget was not just a phone but rather an iPod, an Internet communication device, and a phone all rolled into one. And this is how the story of the iPhone began.
The iPhone has undergone numerous changes over the years but the foundation it was built upon remains the same. Every iteration has stayed true to Apple’s core values: seamless performance, an intuitive interface, an unwavering commitment to user privacy, and a suite of distinctive features that set it apart.
Without further ado, let’s embark on a journey through time and retrace the iPhone’s remarkable history. Witness the marvel of innovation and design that each model introduced to the world.
iPhone Timeline: A Journey Through Time
| In chronological order, here’s the story of Apple’s iconic device: | ||
|---|---|---|
| Year | iPhone Model | Release Date |
| 2007 | iPhone | June 29 |
| 2008 | iPhone 3G | July 11 |
| 2009 | iPhone 3GS | June 19 |
| 2010 | iPhone 4 | June 24 |
| 2011 | iPhone 4S | October 14 |
| 2012 | iPhone 5 | September 21 |
| 2013 | iPhone 5S & 5C | September 20 |
| 2014 | iPhone 6 & 6 Plus | September 19 |
| 2015 | iPhone 6S & 6S Plus | September 19 |
| 2016 | iPhone SE | March 31 |
| iPhone 7 & 7 Plus | September 16 | |
| 2017 | iPhone 8 & 8 Plus | September 22 |
| iPhone X | November 3 | |
| 2018 | iPhone XS & XS Max | September 21 |
| iPhone XR | October 26 | |
| 2019 | iPhone 11, Pro, Pro Max | September 20 |
| 2020 | iPhone 12, Mini, Pro, Pro Max | November 13 |
| 2021 | iPhone 13, Mini, Pro, Pro Max | September 24 |
| 2022 | iPhone SE 3 | March 18 |
| iPhone 14, Pro, Pro Max | September 16 | |
| iPhone 14 Plus | October 6 | |
| 2023 | iPhone 15, Plus, Pro, Pro Max | September 22 |
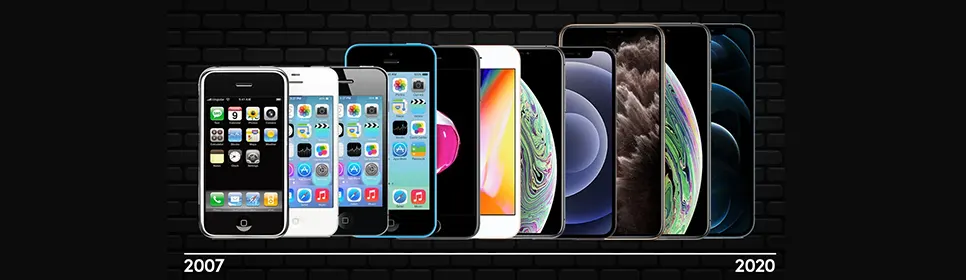
From its first model in 2007 to the latest iPhone 15 series in 2023, Apple’s journey has been one of innovation, vision, and an undying commitment to excellence. Each new iteration of the iPhone brought in new advancements and greater anticipation for what’s coming next.
So, whether you’re an ardent iPhone user or a tech enthusiast looking to understand the evolution of one of the world’s most iconic devices, this timeline offers a snapshot of Apple’s remarkable journey in shaping mobile communication as we know it today. It’s the journey of a product that didn’t just adapt to the times but redefined them.
Historical Overview – Sales Data & User Adoption
The first iPhone was introduced by Steve Jobs in 2007 and its journey has been nothing short of spectacular. Its groundbreaking features and unparalleled user experience have etched it firmly in the global smartphone hierarchy. As for the numbers, they tell a compelling story of unprecedented market dominance and user adoption.
iPhone’s Global Dominance: A Decade of Market Leadership
Since its inception in 2007, the iPhone has revolutionized the smartphone market, commanding a 27.67% global share and achieving over 2.5 billion sales, reflecting its unwavering popularity and innovation.
Spectacular Sales and Sweeping Dominance
Let’s delve deeper into the statistics to truly appreciate Apple’s outstanding achievements:
- The iPhone reigns over the global smartphone market with a 27.67% share, outpacing all other handset manufacturers.
- A testament to its unwavering popularity, the iPhone has been consistently seeing upward of 190 million annual shipments since 2014.
- The global iPhone family has swelled beyond a staggering 1 billion users.
- More than 2.5 billion iPhones have been sold since Apple first launched the product in 2007.
- Reflecting on more recent accomplishments, Apple shipped an impressive 206.1 million iPhones in 2020.
- The iPhone has secured an impressive 65% share of the US market, an indication of the continuous appeal Apple products hold with American consumers.
- Dominance in design and functionality was evident in January 2021 when Apple designed 6 of the top 10 most sold smartphone models globally.
Annual iPhone Shipments from 2010 to 2021
Shipment chronology in the past decade perfectly illustrates the iPhone’s takeover of the global smartphone market.
| Year | iPhone Shipments (in millions) |
|---|---|
| 2010 | 47.4 |
| 2011 | 93.1 |
| 2012 | 135.8 |
| 2013 | 153.4 |
| 2014 | 192.7 |
| 2015 | 231.5 |
| 2016 | 215.4 |
| 2017 | 213.3 |
| 2018 | 208.8 |
| 2019 | 191 |
| 2020 | 206.1 |
| Q1 2021 | 55.2 |
Sources: Statista, IDC.
iPhone’s Global Market Share Dynamics
Here is how the iPhone’s share of the global market has changed over the years. These fluctuations underscore its resilience in the highly competitive and constantly changing smartphone industry.
| Year/Quarter | iPhone Worldwide Market Share |
|---|---|
| 2018 | 13.7% |
| 2019 | 13.22% |
| 2020 | 15.1% |
| Q1 2021 | 16.76% |
Source: Counterpoint Research
From its launch in 2007 to the present day, the iPhone has proven itself a heavyweight in the smartphone industry. With each passing year, it’s evident that the iPhone isn’t just a product but rather a phenomenon.
Global iPhone User Demographics
The iPhone has managed to attract a rather versatile user base throughout the years and this only goes to show it appeals to people from all walks of life. The numbers and demographics, combined with personal experiences and brand loyalty, are at the heart of Apple’s enormous success.

Rising User Base: A Historical Perspective
The iPhone has established itself as a sociocultural phenomenon in recent years. With every passing year, more people across the globe are joining the Apple family.
| Global iPhone Users Over The Years: | |
|---|---|
| Year | No. of iPhone users (worldwide) |
| 2010 | 60 million |
| 2020 | 1 billion |
| 2021 | 1.23 billion |
| 2022 | 1.36 billion |
| 2023 | 1.46 billion |
| 2024* | 1.56 billion |
The device has a particularly massive following in the United States, which is no surprise considering this is where it originates from.
| iPhone Users in The United States Over The Years: | |
|---|---|
| Year | Number of iPhone Users in the US |
| 2012 | 44.53 million |
| 2021 | 116.3 million |
| 2022 | 124.7 million |
| 2023 | 135.97 million |
Delving Deeper: Who’s Using the iPhone?
The iPhone attracts a diverse range of users as the data below suggests:
- Gender Distribution: iPhones enjoy almost equal appeal across genders. Females take a slight lead, constituting 51% of all users, while males comprise 49%.
- Age Demographics: The iPhone enjoys greater popularity among the younger generation, with 44% of users falling in the age bracket of 16-24. Notably, a higher percentage of this age group prefers iPhones over Androids, showcasing the brand’s considerable appeal to younger consumers.
- Voice Assistants & Siri: Most iPhone users have conversed with Siri at one point or another, but only a fraction do so on a regular basis. Perhaps digital assistance is one area Apple can improve in.
- Music Enthusiasts: Apple Music is the second most popular music streaming platform in the world, with over 98 million users as of 2021.
- Brand Loyalty: Approximately 85% of all current iPhone users say they intend to purchase another iteration of the device in the future.
- Ease of Use: Interestingly, 30% of the iPhone users prefer to continue using their current device instead of trying out a new one.
- Integration and Dependence: Apple products have become an inseparable part of their owners’ lives. Some users find it more difficult to part with the Apple ecosystem than to change banks.
Market Share Insights:
| iPhone Ownership Statistics | |
|---|---|
| Location | iPhone Market Share (%) |
| United States | 49.9% |
| Global | 18.55% |
One conclusion we can draw from these statistics is that Apple has created not only a product but an experience. The secret behind the company’s enormous success lies in its ability to earn its customers’ trust, retain their loyalty, and consistently deliver high quality.
Global iPhone User Demographics – Age Groups and Gender
The iPhone appeals to a versatile range of users and this plays a key role in its success story. By segmenting users based on age and gender, we can gain valuable insights into their preferences and better understand the reasons for the popularity of Apple’s products.
A Gendered Perspective
Various studies conducted in recent years reveal that more females than males use iPhones.
| iPhone Users by Gender: | |
|---|---|
| Gender | Percentage |
| Female | 51% |
| Male | 43% |
| Undisclosed/Other | 6% |
Interestingly, data extracted from a 2019 Statista survey echoes this distribution. This shows the gender ratio of iPhone users has remained relatively consistent over time. Women make up a slender majority, with men not too far behind. Around 6% of all users either prefer not to disclose their gender or identify as non-binary, which confirms iPhone owners come from diverse backgrounds.
Age: The iPhone’s Appeal to Young People
Most young people consider technology an integral part of their lives, so it only makes sense that the majority of iPhone users (44%) are aged 16 to 24 years old.
| iPhone Users by Age Group: | |
|---|---|
| Age Group | Percentage of Total Users |
| 16 to 24 years | 44% |
| 25 to 34 years | 34% |
| 35 to 44 years | 13% |
| 45 years & older | 10% |
In essence, if you walk into a room full of iPhone users, approximately eight out of ten people (a whopping 78%) would be under the age of 35. The iPhone, with its blend of style, functionality, and cultural relevance, has captivated the younger generation like no other smartphone. For youngsters, the iPhone is more than a device that enables mobile communication. It has become synonymous with identity, community, and modernity.
A Deep Dive into the iPhone’s Popularity among Youngsters
The question arises: What makes the iPhone so popular among young users? Is it the brand’s smart advertising? The seamless integration of software and hardware? Or Apple’s vast ecosystem that caters to both productivity and entertainment? While it might be a blend of all these factors, one thing is clear. Apple has managed to capture the attention of the youth and transform the iPhone into a symbol of modern tech culture.
The comparatively smaller percentage of users aged 45 and older might be attributed to various factors, including brand loyalty to other devices, perceived complexities of newer technologies, or even economic considerations.
iPhone’s Youth Appeal: A Cultural Tech Phenomenon
The iPhone’s popularity among young users is a testament to Apple’s blend of innovative marketing, seamless integration, and a versatile ecosystem, making it a modern symbol of tech culture.
Breaking down the iPhone user demographics is important not only from a statistical perspective. The data above shows this device has transcended its original purpose to become a cultural and social phenomenon. These insights can also be indicative of the iPhone’s future position in the global technology market.
Usage Patterns – Average Screen Time
Smartphones have become an integral part of our daily lives, so much so that many people consider them extensions of themselves. A recent study carried out by SolitaireD indicates that the lines between virtual and physical reality are getting blurrier and blurrier for some iPhone users. The results confirm our growing dependence on smartphones and provide insights into the evolving dynamics of human-tech interaction.

A Full-Time Commitment
The relationship between an iPhone user and their device is so profound that it almost resembles a full-time job. Astonishingly, the average iPhone user spends about 39 hours and 54 minutes on their device every week. To put this into perspective, this is the equivalent of a regular 9-to-5 work week spread over seven rather than five days. But what are we actually doing during all these hours?
Daily iPhone Usage Breakdown
- Social Media: 1 hour, 23 minutes
- Content Consumption (e.g. YouTube, TikTok): Varies
- Web Browsing: Varies
- Online Shopping: Varies
Perception vs. Reality
It appears most people tend to downplay the amount of time they spend on their smartphones. A staggering 78% of those surveyed grossly underestimated their screen time. They believed they spent an average of 3 hours and 42 minutes daily, but in reality, clocked in 5 hours and 42 minutes. This two-hour discrepancy underscores the insidious nature of smartphone addiction.
Moreover, the “pick-up” habit seems more frequent than users realize. While participants believed they reached for their phones about 40 times a day, the actual number was a jaw-dropping 99 times daily.
The Toll on Interpersonal Relationships
The negative effects of increased screen time extend beyond individual habits. Approximately 36% of the surveyed respondents said excessive smartphone usage was a major source of arguments in their personal relationships. Extrapolated to the broader U.S. population, this suggests that around 104 million smartphone users might have faced relationship problems due to their increased screen time.
Limitations & Implications
Considering the study’s constraints, the results should be approached with caution. The sample size was relatively modest as the study involved only 667 participants from a large pool of over 290 million smartphone users in the US. Also, the methodology depended on users submitting accurate screenshots of their screen time analytics.
With that in mind, the study raises some important questions despite its limitations. Some of these include:
- Are we losing touch with the real world as we immerse ourselves more in the digital world?
- What can be done to strike a healthier balance between connectivity and real-life interactions?
In a world where the line between physical and virtual reality is constantly blurring, it’s more important than ever to recognize the value of unplugging from our smartphones, if only for a little while. While limited in scope, this study underlines the importance of digital mindfulness in the modern age of hyperconnectivity.
Loyalty and Retention – Upgrade Cycles
A symbol of innovation and technological excellence, the iPhone has been enjoying massive success ever since its inception. According to the Financial Times, Gen Z representatives account for more than a third of all iPhone users in the United States.
Another recent study conducted by CIRP provides some interesting insights into the frequency of iPhone upgrades among consumers. The results reveal the consumer behavior of Gen Z can have a significant impact on Apple’s product lifecycle. Excerpts of the study were also featured in an AppleInsider article.
Gen Z: The “Upgrade Generation”
Younger customers, particularly those aged 18 to 24, have an insatiable appetite for the latest iPhone. The statistics speak for themselves:
- About 45% of iPhone users aged 18 to 24 upgrade their devices after less than 2 years.
- Approximately 13% of iPhone enthusiasts upgrade their devices once a year or more frequently.
CIRP fittingly titled their findings “Younger Customers Are Addicted to iPhone Upgrades.” And who can blame them? With Apple’s regular launch of state-of-the-art devices, it is only logical that members of this demographic group want the newest features at their fingertips.
Beyond Gen Z: The Broader Upgrade Landscape
The enthusiasm for Apple products extends beyond Gen Z. Data reveals that across age groups, especially below 54 years, approximately 10% of users tend to hold on to their iPhones for less than a year.
However, the majority of iPhone users show more restraint:
- Most users upgrade their iPhones every 2 to 3 years.
- Individuals aged 65 or older comprise the only age group that upgrades less frequently. People from this category usually keep their iPhones for more than 3 years.
The increasing longevity of iPhones, backed by their robust build and frequent software updates, ensures that users who upgrade less frequently can comfortably enjoy their devices for several years.
How Upgrade Cycles Have Changed Over Time
In recent years, we have been observing fluctuations in the iPhone upgrade cycles. Between 2019 and 2021, there was a growing trend of consumers holding onto their iPhones, with 34% of all users having a device aged at least three years.
- In 2022, there was a sudden reversal of this trend. The majority of consumers reported keeping their iPhones for 2 to 3 years or longer.
- March 2021 emerged as the peak month for the average age of iPhones, but 2023 ranks as a close second.
What might have caused the surge in upgrades in 2022? CIRP suggests this spike was caused by several factors, including the inflow of government stimulus checks and the decreased consumer expenses during the pandemic. The restrictions on travel and entertainment gave consumers the financial leeway they needed to purchase newer iPhone models. The upgrade cycle was further accelerated by Apple’s aggressive trade-in programs.
Future Prospects
The unique confluence of social and economic events in recent years makes it challenging to predict the trajectory of future iPhone upgrade patterns. With that in mind, more users might start recognizing the benefits of longer device retention as iPhones are becoming increasingly durable and more advanced. Apple is known to release frequent updates that further increase the lifecycle of its smartphones, while also giving users access to the latest innovations.
iPhone’s Future: Balancing Longevity with Innovation
The future of iPhone upgrades hinges on a delicate balance between increasing device durability, Apple’s frequent software updates, and evolving consumer behaviors.
Apple’s success is rooted not just in the quality of its products but in its ability to understand consumer behaviors and evolve with them. As we look to the future, the dynamics between user loyalty, device longevity, and the appeal new devices hold will prove essential in shaping the iPhone’s commercial journey.
Device Statistics – Top-selling iPhone Models
Apple’s iPhone has not only revolutionized the smartphone industry but also has been consistently outperforming the competition with each new release. In this section, we cover the best-selling iPhone models and show you how storage capacity preferences have changed over time.
iPhone Hall of Fame
When you look at the best-selling iPhones, some models are legendary. Let the numbers speak for themselves.
| Ranking | iPhone Model | Units Sold |
|---|---|---|
| 1 | iPhone 6 & 6 Plus | 222.4 million |
| 2 | iPhone 6S & 6S Plus | 174.1 million |
| 3 | iPhone 5S | 164.5 million |
| 4 | iPhone 7 | 159.9 million |
| 5 | iPhone 11 (all versions) | 159.2 million |
| 6 | iPhone XS, XS Max, and XR | 151.1 million |
| 7 | iPhone 5 | 146.2 million |
| 8 | iPhone 8 & 8 Plus | 124.7 million |
Sources: TheStreet, Telegraph, Wikipedia
It’s worth noting that the iPhone 6 holds the title of the best-selling iPhone ever, with a whopping 222.4 million units sold. Another impressive fact about this device is that it ranks as the third best-selling smartphone of all time.
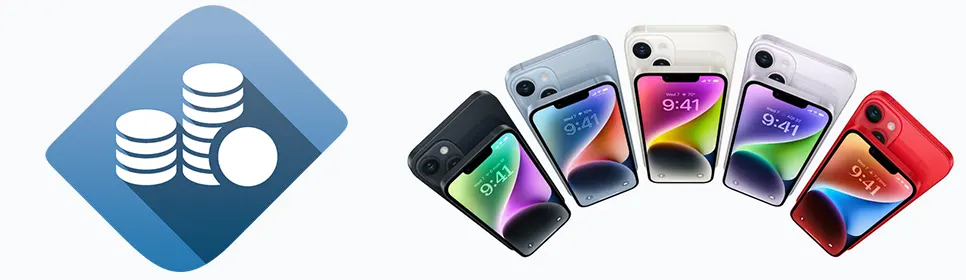
Sales Snapshot: iPhone 13 and 14
Fast forward to the current times, the iPhone 13 and 14 models offer interesting insights into consumer buying patterns:
- The iPhone 14 models made up 21% of iPhone sales in their first weeks.
- In contrast, iPhone 13 models accounted for 16% of sales in their corresponding period the previous year.
- The iPhone 13 alone clinched a 15% share of sales, while its sibling, the iPhone 13 mini, lagged behind with a mere 4% share.
- The iPhone 12 mini was less successful, contributing only 1% to sales before its discontinuation.
- The iPhone 11 was released four years ago but remains one of Apple’s most successful iterations as it accounts for 9% of all sales. It outperformed the iPhone SE by two percentage points.
Bigger Storage, Bigger Appetites
It’s evident that when it comes to storage, consumers are always hungry for more, and data captured by CIRP perfectly illustrates this point.
- As many as 60% of iPhone 13 Pro buyers in 2021 chose the 128GB model.
- By means of comparison, about 50% of consumers in 2022 went for the 256GB version of the iPhone 14.
- The demand for bigger storage largely results from camera advancements which, in turn, lead to significant increases in the size of video and image files. A single 48-megapixel ProRAW shot with the iPhone 14 Pro can eat up 75MB of your storage.
Given these trends, it’s hardly surprising that the iPhone 14 Pro and 14 Pro Max offer larger storage options of up to 1TB.
Throughout the past decade, Apple has been consistently demonstrating its ability to stay on top of the competition by taking the needs of users in mind. One thing is clear, though. Storage becomes increasingly important for modern consumers as mobile apps get bulkier and camera technology continues to improve.
iPhone Sales Revenue Statistics
The story of Apple’s iPhone is one of immense success, with staggering revenue figures that affirm the brand’s dominance in the global smartphone market. Android places first in terms of sales, but Apple’s ownership of the iPhone hardware and its proprietary software gives it a competitive advantage that enables it to generate significantly greater revenue than rival brands.
A Look into Apple’s Revenue
The table below demonstrates how revenue from iPhone sales has changed over time. Also included is information about the device’s share of the overall revenue from smartphone sales.
| Year | iPhone Revenue | Share in Total Revenue |
|---|---|---|
| 2009 | $13.033 billion | 30.16% |
| 2010 | $25.179 billion | 38.31% |
| 2011 | $45.998 billion | 43.61% |
| 2012 | $78.962 billion | 51.14% |
| 2013 | $91.279 billion | 53.08% |
| 2014 | $101.99 billion | 56.19% |
| 2015 | $155.04 billion | 65.95% |
| 2016 | $136.7 billion | 62.48% |
| 2017 | $141.32 billion | 60.46% |
| 2018 | $166.27 billion | 61.80% |
| 2019 | $142.381 billion | 53.89% |
| 2020 | $137.78 billion | 48.95% |
| 2021 | $191.973 billion | 51.9% |
| 2022 | $205.49 billion | 51.52% |
| 2023 (as of Q3) | $156.78 billion | 53.36% |
In 2022, Apple saw its highest annual revenue to date: an eye-watering $394 billion. But it’s not just about the numbers. Its triumphs aside, the tech giant has faced various challenges throughout its history which it managed to expertly overcome.
The Highs and Lows
While the numbers tell a story of roaring success, it’s equally essential to understand the context. The fourth quarter of 2022 witnessed a shipment of 70 million iPhones, showing a dip from the 81.9 million shipped in the same quarter of both 2021 and 2020. And yet, despite this dip, Q1 of 2023 saw Apple earning an astonishing $65.8 billion solely from iPhone sales. The ratio of revenue to units sold demonstrates the tech giant’s ability to maximize profits even during challenging periods.
Here is another stat we found intriguing. More than 2.5 billion units have been sold worldwide since Apple released the first iPhone in 2007. The Q4 2022 figures reaffirm Apple’s market dominance, with iPhones capturing a solid 24% market share of all new smartphone sales.
A Dominant Force
Apple has experienced both ups and downs throughout its history. The company sold 55.8 million units in 2010 but sales soared to a record-breaking 225 million last year. Another historic peak occurred in Q4 2020 when the company sold more than 90 million new iPhones.
However, Apple’s success doesn’t revolve around the iPhone alone. Their iPad, Mac line, and customer services significantly contribute to the company’s revenue. All products combined generated nearly $38 billion in revenue during the first quarter of the 2023 fiscal year.
Apple’s Resilience: Sales Triumphs Amid Challenges
Apple’s enduring success, marked by record-breaking iPhone sales and diversified revenue streams, reflects its ability to innovate and maintain market dominance despite global challenges.
Challenges & Triumphs
Throughout its history, Apple has seen challenges like all tech giants. The company anticipated a decline of $4 to $8 billion in sales for Q1 2022 due to pandemic-related production halts in China but succeeded in retaining its leading position on the global market, nevertheless.
A pivotal aspect of Apple’s success has been its commitment to innovation and consistent upgrades, paired with unmatched brand loyalty. All these factors combined enable the company to maintain its market dominance despite the challenges it faces.
The Bottom Line
With an average selling price of $944 in the US, it becomes apparent that the iPhone is not only a major source of revenue for Apple but also a testament to the company’s expert marketing.
Security and Privacy
Safety is becoming a major determining factor in consumer choices as cyberattacks and the public’s awareness of them are increasing. With that said, Apple certainly has a competitive edge over rival brands where smartphone security is concerned.

Key Insights:
- A Shift in Preference: Nearly half of all Android users contemplate switching to iPhone due to concerns over security and privacy.
- The Perception of Security: Consumers felt the most secure with the Apple iPhone 13 Pro Max, followed by the Samsung Galaxy S22 Ultra.
- Data Recovery Success: 75% of Apple users have managed to successfully retrieve their lost data, compared to only 55% of Android users.
- Reasons for Switching: Around 49% of all Android users who contemplate switching to iOS are motivated to transition by the superior levels of privacy and security Apple products offer.
| Device Safety Perception | |
|---|---|
| Device | Percentage Feeling Safe |
| iPhone 13 Pro Max | 72% |
| Samsung Galaxy S22 Ultra | 34% |
Samsung Galaxy S22 Ultra users are more than twice less likely to feel secure using their devices compared to iPhone 13 Pro Max users. Apple also has an edge over Android when it comes to password management. According to Bankless Times, 54% of all people who rely on Apple’s iCloud Keychain describe themselves as feeling “extremely” secure compared to only 47% of Google Password Manager users.
Reasons for Android to Apple Switch
- Security and Privacy Superiority: 49%
- iOS 16 Security Features: 33%
The iOS 16 became a game changer when Apple released it in September 2022. Approximately 33% of Android users contemplating a switch said at the time they were motivated by the advanced security features of iOS 16.
Security Habits Breakdown:
When it comes to digital safety behaviors, Apple users take the trophy. Here are a few traits they commonly share.
- Favoring six-digit over four-digit pins
- Regularly monitoring their location tracking
- Using facial recognition
Conversely, Android users are more prone to use fingerprint recognition, a feature that has its own benefits.
Frequency of Data Breaches:
A combined 40% of Apple and Android users have become victims of malware attacks or cyber scams. However, most iPhone users said they have never experienced security breaches. If breaches did occur, Apple users were significantly more likely to recover their lost data compared to Android users.
Another interesting finding is that Apple users reported losing their phones more frequently. This can be attributed to the so-called Peltzman Effect, a phenomenon characterized by engaging in riskier behaviors when a person feels overly secure.
Apple is a clear leader when it comes to user security perceptions, which is not to say Android does not offer high safety levels to consumers. In general, iPhone users experience fewer breaches and have better success rates at retrieving stolen or lost data. They also tend to engage in safer data practices as they favor longer passwords and turn off location services more often than Android users.
Conclusion
The iPhone has emerged as a clear leader in the global smartphone market as the comprehensive statistics we have compiled suggest. No other mobile device can match Apple’s flagship product when it comes to sales, cultural impact, security, and level of technological innovation.
Key Takeaways:
- Standing Tall Amidst Giants: Even in the face of stiff competition, the Apple iPhone stands its ground and retains its dominant market share.
- The Future Lies in Innovation: The iPhone is unlikely to lose its appeal anytime soon as Apple is committed to constantly innovating and improving its products. The numbers suggest this device will continue to be a best-seller, attracting buyers with its robust hardware and equally capable software.
- A Revenue Powerhouse: The iPhone is Apple’s most successful product from a financial perspective as it accounts for approximately half of the company’s revenue. Apple consistently works to better this leading product to ensure the iPhone’s success story continues in the future.
| Apple’s Remarkable Presence | |
|---|---|
| Aspect | Statistic |
| iPhone’s Contribution to Revenue | 50% |
| Global iPhone Users | 1.6 Billion |
As you already saw, the numbers speak volumes about the iPhone’s solid position in the global smartphone market. Apple has created not just a product, but an ecosystem, a culture, and for many, a way of life. With over 1.6 billion iPhone users worldwide, the iPhone has undoubtedly established itself as an iconic device.
But statistics and data, as valuable as they are, do not give us the whole picture. The true essence of the iPhone’s success lies in the individual experiences of its users. How many memorable moments have been captured on its camera? How many projects were conceived on its Notes? How many relationships have been built via its apps?
As we finish this article, we turn the lens toward you, the reader. Do you own an iPhone? And if you do, what has your experience been? Will you continue to be a part of the Apple family, or have you pondered over switching to Android? After all, the iPhone’s story isn’t just about technology but also about the people who use it.
In the end, whether you’re Team iPhone or Team Android, one thing is certain: the smartphone revolution Apple ignited has transformed our lives for good. And as the chapters of this story continue to unfold, we eagerly anticipate what the future holds.