Android Statistics and Facts

Brief Overview of Android and Its Significance in the Smartphone Industry
Android has been recognized worldwide as the premium operating system of Google, and as such, it has become an emblem of innovation and adaptability in the ever-growing smartphone industry. The operating system was created by a company called Android Inc., with the original purpose of the brand being to create digital camera solutions. However, with the evolving technological landscape, Google recognized the huge potential of the company and acquired Android Inc. in 2005, eventually transforming the brand into the mobile OS giant it is today.
| Android at a Glance | |
|---|---|
| Founded by | Android Inc. |
| Acquired by Google | 2005 |
| Initial Purpose | Digital Cameras |
| Transition to Mobile OS | 2007 |
Key Facts:
- Active Users: Over 2.5 billion as of recent data.
- Countries Active: Spanning over 190 countries.
- Major Players: Samsung, LG, Motorola, HTC, among others.
- First Billion Users: Achieved in 2014.
As Android grew, so did Google’s influence over the company. The platform that used to give manufacturers the freedom to customize their products began implementing certain limitations on the default apps tech brands incorporate in their newly released devices, ensuring that Google’s products are representing the majority of the the suite of applications of Android devices.
List of Key Developments:
- Google Play’s Evolution: Revenue reached $38.6 billion in 2020.
- App Availability: Over 2.9 million apps were available by 2020.
- App Downloads: A staggering 108 billion times in 2020.
- Dominance: Android has a market share of over 85% in countries like Brazil, India, and Turkey.
- Challenges: Regulatory issues regarding revenue shares and third-party payment options emerged in 2021-2022.
| Android’s Journey | |
|---|---|
| Foundation | 2003 by Android Inc. |
| Initial Vision | Digital camera operating platform |
| Google’s Acquisition | 2005 for US$ 50 million |
| OS Nature | Linux-based, open-source (Apache-v2 license) |
| Initial Design | Aimed at low-cost handsets with numeric keypads |
Android’s evolution from a humble digital camera OS to a leading global mobile operating system is simply remarkable. Thanks to its ability to adapt and the visionary approach of Google, Android has achieved a worldwide dominance in the smartphone operating system scene but it has also introduced a new era for smartphones. With a plethora of statistics and facts, this overview barely scratches the surface of Android’s rich gallery of products and solutions.
A Range of Devices Keeps Android in the Lead
Android’s presence in the smartphone market has changed the whole industry. The launch of the platform and the rapid growth of its influence can be credited to its advanced features and user-friendliness. But it was mainly the widespread adoption of the platform by major smartphone companies that significantly boosted Android’s success. Brands like Sony, Samsung, and HTC used to rely on their individual mobile ecosystems, but once they recognized Android’s potential, they decided to optimize their devices so they can run on Android.

| Android’s Adoption by Leading Smartphone Manufacturers | ||
|---|---|---|
| Brand | First Android Phone | Year Introduced |
| Sony | Xperia X1 (indirectly via UI overlay) | 2008 |
| Samsung | Galaxy i7500 | 2009 |
| HTC | Dream (T-Mobile G1 in some markets) | 2008 |
Key Facts:
- Leading OS: Since 2010, Android has held the title of the most-used smartphone operating system.
- Dominant Market Share: In 2022, Android’s market share in the smartphone operating system field represented an impressive 70%.
- Price Advantage: Typically, when compared to its rival, Apple, Android tends to provide devices at a more affordable price range. This plays a significant role in its widespread adoption, especially in expanding markets.
However, Google’s vision for Android was not limited to smartphones. The tech giant discovered a great potential in the tablet manufacturing sector, which at that time, was dominated by Apple’s iPad products. That determination sparked the expansion of Android’s domain, launching tablets running on Android, becoming a direct competitor of Apple’s iPads. At first, the Android-running tablets enjoyed low acceptance rates, with fewer app optimizations introduced to the Android tablet sector. However, the platform shows reliance and was able to adapt, which earned the operating system its current huge popularity and widespread table integration.
Android Tablets: Rising to Challenge Apple’s Reign
Android tablets initially faced skepticism but have since adapted and risen to become a prominent player in a market once dominated by Apple’s iPads.
| Evolution of Android Tablets | |
|---|---|
| Year | Key Milestone |
| 2010 | Introduction of Android 3.0 Honeycomb, the first tablet-focused version |
| 2012 | Android emerges as the leading tablet operating system |
| 2023 | Android holds approximately 46% of the global tablet market share |
The early years of Android tablets faced challenges, which were mainly due to the lack of app optimizations for Android-run tablets. However, as developers started creating more tablet-friendly apps and manufacturers introduced high-quality hardware at competitive prices, Android tablets began to flourish. By the end of 2012, they managed to surpass the iPad in terms of market share, marking a significant time in Android’s history.
Noteworthy Points:
- Android’s open-source nature and ability to easily adapt allowed manufacturers to create a wide range of tablets, catering to consumers with different needs and budgets.
- Collaborations with renowned brands like Samsung, ASUS, Google’s own Nexus, and later Pixel line of tablets, demonstrated Android’s ability to conform to different standards for a tablet OS.
- The introduction of features like multi-window support, more advanced notifications, and enhanced keyboard functions made Android tablets extremely appealing to both casual users and professionals.
Android’s Regular Updates: Keeping Ahead of the Curve
To further cement Google’s dedication to the mobile ecosystem, Android has always stayed abreast of technological innovations. It’s extremely important for an operating system to continuously evolve, especially in a time when smartphones are improving their designs and functionalities at an unprecedented rate. As Android gets updated regularly, Google ensures that both new devices and older models can deliver great performance, security, and convenient user experience. As of July 2023, an evaluation of the market reveals that Android 11 reigns as the most-used operating system in smartphones, with Android 12 closely trailing behind. Tablets, however, present a slightly different scenario, with Android 13 leading the tablet OS sector. The surprising stats about the tablet market includes Android 9 Pie, which is a much older OS version, which, however, holds a rather high position when it comes to market presence.

The start of Android’s OS endeavors can be traced back to November 5, 2007, when the platform launched its first public beta product. Since then, the platform has come a long way, with the Android 1.0 version appearing on the smartphone scene on September 23, 2008. When we evaluate the platform’s journey, we notice an interesting pattern. Google has religiously followed an annual cycle for Android’s evolution since 2011. Google I/O is typically the event during which the company announces its new major releases. The first step of the release process is making a beta version available to Google Pixel devices. The final step of the product release is concluded by the end of the year, when a more stable version of the OS is made available to a broader Android consumerbase.
| Android Version History | |||
|---|---|---|---|
| Code Name | Version Numbers | API Level | Release Date |
| No codename | 1 | 1 | September 23, 2008 |
| No codename | 1.1 | 2 | February 9, 2009 |
| Cupcake | 1.5 | 3 | April 27, 2009 |
| Donut | 1.6 | 4 | September 15, 2009 |
| Eclair | 2.0 – 2.1 | 5 – 7 | October 26, 2009 |
| Froyo | 2.2 – 2.2.3 | 8 | May 20, 2010 |
| Gingerbread | 2.3 – 2.3.7 | 9 – 10 | December 6, 2010 |
| Honeycomb | 3.0 – 3.2.6 | 11 – 13 | February 22, 2011 |
| Ice Cream Sandwich | 4.0 – 4.0.4 | 14 – 15 | October 18, 2011 |
| Jelly Bean | 4.1 – 4.3.1 | 16 – 18 | July 9, 2012 |
| KitKat | 4.4 – 4.4.4 | 19 – 20 | October 31, 2013 |
| Lollipop | 5.0 – 5.1.1 | 21- 22 | November 12, 2014 |
| Marshmallow | 6.0 – 6.0.1 | 23 | October 5, 2015 |
| Nougat | 7 | 24 | August 22, 2016 |
| Nougat | 7.1.0 – 7.1.2 | 25 | October 4, 2016 |
| Oreo | 8 | 26 | August 21, 2017 |
| Oreo | 8.1 | 27 | December 5, 2017 |
| Pie | 9 | 28 | August 6, 2018 |
| Android 10 | 10 | 29 | September 3, 2019 |
| Android 11 | 11 | 30 | September 8, 2020 |
| Snow Cone | 12 | 31 | October 4, 2021 |
| Snow Cone v2 | 12.1 | 32 | March 7, 2022 |
| Tiramisu | 13 | 33 | August 15, 2022 |
| Upside Down Cake | 14 | 34 | October 4, 2023 |
Key Takeaways:
- Consistency in Updates: Since 2011, Android’s OS platform has been consistently updated every year.
- Diverse User Base: Despite new releases, older OS versions like Android 9 Pie still have a substantial user base, especially in the tablet sector.
- Beta to Stable: Google has maintained a strategy of releasing a beta version to Google Pixel devices, allowing them to spot areas that need improvement before the OS version gets a broader release.
- Intriguing OS Names: Initially, Android adopted the tradition of naming its OS releases using popular and delicious desserts. The last Android version that followed through with the naming tradition was Android Pie (9.0). The versions which were released after that were following a basic naming strategy, with newer versions simply adding increasing numbers after “Android”.
In conclusion, Android’s regular updates showcase Google’s commitment to adaptability and innovation. With each version, users are introduced to a plethora of features, enhancements, and security updates, which ensure that their devices, both new and old, deliver an impeccable experience. Starting with dessert names and reaching to the point of using only numbers, the way Android has named its OS versions is another indicator for the platform’s growth and Google’s dedication to ensure a more connected future.
Android’s Current Global Market Share
Android’s dominance in the global market cannot be denied, with its market share by the third quarter of 2023 reaching 70.5%. This is another indicator of the platform’s ability to adapt, provide various device options, and offer great solutions at a cost-effective price range. Even though Apple’s iOS, which is Android’s biggest competition, is well-known for its premium quality solutions, its market share for the third quarter of 2023 reached only 28.8%.

The Ever-Evolving Mobile OS Titans
The main difference between the two operating systems is in the brands that have adopted these platforms. To ensure a more closely integrated ecosystem, iOS has been exclusively operating with Apple devices. Meanwhile, Android has been chosen by various manufacturers, including tech juggernauts like Samsung, Google, OnePlus, and more. The thing that is commendable about Apple’s influence is the version adoption among iPhone and iPad users. By February 2023, 81% of iOS devices were running on iOS 16, which was the latest version of the OS at the time. In comparison, by January 2023, only a quarter of Android devices were running on the latest version at the time – Android 13.
iOS vs. Android: Navigating the Latest Updates and User Adoption
While iOS 16 boasts an impressive 81% adoption rate among Apple devices, Android 13 lags behind with only a quarter of devices updated to the latest version, reflecting the distinct upgrade paths of these competing platforms.
Smartphone Evolution
The 2010s marked the era when touchscreen smartphones started overshadowing phones with basic features. This shift was evident in the sales growth from 139 million units in 2008 to a staggering 1.43 billion units by 2021. However, 2020 did witness a slight dip, registering sales of 1.38 billion units, primarily due to the COVID-19 pandemic. This shift to touchscreen devices boosted the popularity of manufacturers like Apple, Samsung, and more recently, Xiaomi. However, major brands like BlackBerry and Nokia couldn’t keep up with the demand for a more advanced smartphone performance.
Interesting Facts:
- Global Dominance: As of Q4 2023, Android globally held a market share of 69.44%, outpacing iOS which stood at 29.89%.
- U.S. Scenario: Things look completely different in the US, with Apple’s iOS standing tall with a 57.11% market share, whereas Android follows at 42.41%.
| Snapshot: Q4 2023 Global OS Market Share | |
|---|---|
| Operating System | Market Share (%) |
| Android | 69.44% |
| iOS | 29.89% |
| Samsung | 0.36% |
| KaiOS | 0.11% |
| Windows | 0.02% |
| Others | 0.19% |
Android and iOS collectively dominate, accounting for over 99% of the global market share.
Editor’s Highlights:
- Global Overview: In Q4 2023, Android leads with a 69.44% global market share, with iOS trailing behind by a 39.55% margin, with a market share of 29.89%.
- Yearly Dynamics: 2023 saw Android’s global share slightly drop by 1.20% from the previous year to 70.27%. Conversely, iOS rose by 1.16% to settle at 29.01%.
- U.S. Dissection: iOS held the crown in the U.S. for Q4 2023 with a market share of 57.11%. Even though Android was trailing behind, it wasn’t by a large margin, with a market share of 42.41%.
- U.S. Yearly Analysis: 2023 recorded iOS with a 57.92% share in the U.S., marking a 1.18% increase. Android, on the flip side, witnessed a 1.28% drop, concluding the year at 41.66%.
Most Popular Android Device Manufacturers
Android is a factor with a major role in the expansion of the mobile industry, with the platform contributing to the dynamic in the sector. The ability to adapt and the user-friendly nature of the operating systems are just a few of the reasons that made Android so popular among smartphone users. In addition, a huge factor that has made the operating system stand out is its integration by major manufacturers, all competing for the approval of consumers.

Historical Insights: Android Dominance
Samsung is one of the tech companies that have adopted Android’s OS ever since the early days of the platform. The manufacturing giant maintained a strong position on the smartphone market due to its consistency in offering high-quality and innovative products. However, the 2010s saw the rise of Chinese manufacturers who managed to replace major names like HTC and LG. Nowadays, these Asian tech companies are responsible for more than 50% of Android device sales across the globe.
Manufacturer Market Share Snapshot
A glance at the market share of different Android manufacturers offers a fascinating insight:
| Android Phone Manufacturer | Market Share | Change in Last 30 Days |
|---|---|---|
| Samsung | 34.1% | No change |
| Xiaomi | 14.2% | No change |
| Oppo | 10.8% | No change |
| Vivo | 10.7% | No change |
| Huawei | 5.2% | ↑ 2% |
| Realme | 4.6% | No change |
| Amazon | 3.5% | ↑ 6% |
| Motorola | 2.7% | ↑ 8% |
| Infinix Mobility Limited | 1.6% | ↑ 5% |
| Tecno Mobile Limited | 1.6% | ↑ 4% |
This table indicates a predominantly stable market, with Samsung maintaining its first position. However, noteworthy shifts are evident among other manufacturers.
Key Statistics and Takeaways
- Over 80% of mobile devices that run on Android are using versions that have been released after the 7.11 OS. This demonstrates the adaptability of the
- In 2020, Samsung Galaxy A51 emerged as the top dog among Android smartphones with a remarkable industry share of 2.3% . Following closely were Redmi 8 with 1.9% and Samsung Galaxy S20+ with 1.7%.
- Samsung’s dominance is evident, as the company is currently the largest producer of Android smartphones worldwide. That is not to say that there are no brands competing with the top dog. Apple and Huawei together shipped 76.5 million devices, grabbing an impressive 22% market share.
- Xiaomi isn’t far behind, securing its spot as the second-largest Android manufacturer globally, with approximately 49 million units sold in Q1 2021. Oppo marks its presence in the market with sales of 37.6 million devices, taking the third position.
- 2021 was a landmark year for Samsung’s S21 Ultra, which enjoyed the title of best selling Android smartphone.
Android Titans of 2023
The year of 2023 also witnessed some spectacular Android releases. Let’s delve into the top 5 Android smartphones that have made waves this year:
- Samsung Galaxy S23
- Google Pixel 7 Pro
- Samsung Galaxy Z Fold
- OnePlus 11 5G
- OnePlus Nord N300
In conclusion, the Android marketplace, characterized by its diversity and rapid evolution, offers something for every consumer. From top-class flagship smartphones to budget-friendly devices, Android continues to cater to a global audience with various preferences. That way, the platform secures its dominance in the mobile OS landscape.
Android User Demographics
The trajectory of Android’s growth in the mobile operating system field has been nothing else but impressive. A part of its success can be attributed to its diverse and broad user demographic. By studying these demographics, one can recognize the patterns, preferences, and Android users’ habits, providing a clearer picture of the global impact of the operating system.
Global Reach
In 2023, the Android platform enjoys a massive user base spread across 190 countries, with a user count of 3.6 billion individuals. This number showcases not just the platform’s current dominance but also suggests it will continue to grow. The evolution of Android users over the years is detailed below:
| Year | Number of Users (in billions) |
|---|---|
| 2023 | 3.6 |
| 2022 | 3.3 |
| 2021 | 3 |
| 2020 | 2.8 |
| 2019 | 2.5 |
Geographic Adoption
Different regions have shown varying rates of Android adoption. India, for instance, has adopted almost no other mobile operating system but Android, with an adoption rate nearing 100%. Conversely, regions like the UK and the US show lower adoption rates, falling below 50% and 60% respectively. Japan’s adoption rate stands at just over 60%.
| Country | Adoption Rate |
|---|---|
| India | ~100% |
| Japan | >60% |
| United States | <60% |
| United Kingdom | <50% |
| Germany | 30% |
| China | 20% |
| Brazil | <20% |
| Nigeria | <10% |
Demographic Distribution
Age Groups:
In 2021, Android devices seemed to be preferred by both the younger and middle-aged groups. About 95% of the OS user base included both the 18-29 and 30-49 age groups. Following them were the 50-64 age group at 83% and those above 65 years, representing 61% of the Android user base.
Gender:
Gender distribution showed that Android devices were slightly more popular among males, with females representing 43% of the user base and males constituting 57%.
Key Takeaways:
- The number of Android users is increasing continuously, with projections showing a promising trend.
- Despite numerous Android users being located in the US, the iOS continues to dominate this market. Meanwhile, regions like Brazil, India, Indonesia, Vietnam, and Turkey showcase a significant preference for Android, with market shares exceeding 85%.
- Android’s global market share stands at an impressive 86.1%, indicating its vast acceptance worldwide.
- Based on the age demographics, it is clear that there has been an increasing Android popularity among the younger generation, with almost every individual in the age group of 18-49 using an Android device.
- Even though there has been a slight tilt towards males, the gender statistics reveal that Android distribution between genders is somewhat balanced.
- To summarize the results, demographic data showcases the global acceptance of Android devices and the platform’s ability to meet the preferences of people of all genders and age groups. Android continues to be the choice of billions, further ensuring its position as a leading mobile OS.
Android Security
The open ecosystem of Android gives plenty of opportunities for innovation and customization. However, having so much flexibility also poses certain security challenges. With millions of applications available on the Play Store, ensuring a secure environment becomes paramount.

Security Landscape: By the Numbers
- Volume of Malicious Apps: Android malware statistics reveal that the platform’s ecosystem has a staggering 4.18 million of malicious apps. This figure indicates the magnitude of the security challenges Android faces while striving to ensure a safe environment for its users. (Source: Gdatasoftware)
- Daily Malicious App Emergence: On a daily basis, approximately 11,000 new malicious apps appear in the Android ecosystem. The thing that is concerning is the fact that most of these apps are in the form of adware that mainly targets individual users rather than enterprises.
- The Joker Malware Threat: One of the more notorious strains of malware that have spread across the Android ecosystem is the Joker malware, also known as Bread apps. Google has been active in handling this issue by removing over 1,700 apps infected with this malware from the Play Store. Despite Google’s measures to deal with the malware threats, many of these apps had been downloaded over 50,000 times. The way these apps operate is by executing fraudulent SMS services to exploit users. (Source: Zdnet)
- Google Play Protect: To combat these security threats, Google has implemented its native security system – Google Play Protect. It scans more than 500,000 apps daily, ensuring that harmful apps are removed from the ecosystem before they even make it to the Play Store. (Source: Android Security and Privacy Report)
- Misleading App Ratings: A high app rating is not always synonymous with security. There are developers of malicious apps who have managed to trick the system. An app with a 4.5-star rating and more than 7,000 positive reviews was identified as a scam. These reviews were used to boost credibility and lure unsuspecting users. (Source: McAfee)
- Hidden Threats: A significant portion of malicious apps resort to ways that allow them to remain unnoticed. Nearly 50% of malicious apps hide their presence on devices, making them difficult to identify and uninstall. These hidden apps often bombard users with unwanted ads, causing not just annoyance but also putting users at potential security risks. (Source: McAfee)
Key Takeaways:
- Proactiveness is Essential: Google’s efforts, such as the use of Google Play Protect, emphasize the need for proactive measures to be implemented whenever there are increasing security challenges.
- User Vigilance: Despite Google’s efforts for an early detection of threats, users are also required to be careful whenever they are downloading apps on their devices. The presence of high-rated malicious apps shows that users should consider other factors besides ratings, and make their own research.
- Hidden Malware: The fact that a significant portion of malware apps manages to remain hidden on devices emphasizes the need for security software. Users should also be extra careful and monitor for any unexpected ads on their devices.
In conclusion, while Android offers huge flexibility and an extensive app ecosystem, the open nature of the platform comes with its set of security challenges. Google, along with third-party security firms, continually works to improve the safety standards of the platform. Meanwhile, users can make their Android experience more secure by staying informed and always being cautious of the apps they install.
Mobile Cyberattacks Against Android Users
While the rise of mobile technology has led to more convenience and flexibility, it has also triggered way more cyber threats. As Android is a leading OS, it has become the main target for numerous malicious attacks, which take advantage of the platform’s inherent weaknesses.

Understanding the Threat Landscape
- Rapid Growth of Malicious Activity: The Zimperium’s 2023 “Global Mobile Threat Report” indicates a 51% rise in unique mobile malware samples in 2022, amounting to 77,000 unique samples each month. What’s worrying is that 23% of Android apps were found to be malicious, leading to a staggering 187% rise in compromised devices within a year.
- Phishing Predominance: The success rate of phishing attacks is obvious as its has been revealed that an average of four malicious phishing links are being clicked on every device that has been compromised. Most of these phishing sites (80%) are made specifically for mobile platforms, which further proves their effectiveness.
- Corporate Mobile Usage: In recent years, there’s been a significant shift in the number of users utilizing their mobile devices for business purposes. A report by Verizon indicated that 58% of workers used mobile devices more for business in 2022 than the previous year. As mobile devices get even more integrated into professional environments, they become even more obvious targets for cyber attackers.
Android vs. iOS – The Threat Disparity
- Android’s Increased Vulnerabilities: Android has consistently shown more security weaknesses than iOS, with annual reports disclosing numbers of vulnerabilities ranging between 500-900, as opposed to iOS’s roughly 300 vulnerabilities in recent years.
- App Development Errors: Android app developers often make more errors, especially when it comes to cloud storage interactions. For instance, while only 2% of iOS apps access unprotected cloud instances, about 10% of Android apps are also experiencing such failures. Such mistakes expose user data to potential breaches.
- Nation-State Espionage & Cybercrime Threats: Georgy Kucherin of Kaspersky points out that while Android is more prone to generic cyber threats, both Android and iOS are equally vulnerable to high-grade espionage spyware. Recent cyber espionage campaigns have confirmed that it is crucial to target both platforms.
- Reduced iOS Jailbreaking: As the number of jailbreaking apps that run on the latest iOS versions has increased significantly, the attacks targeting solely Android devices have decreased. Even though jailbreaking apps allow users more flexibility, they also bypass some essential security functionalities.
Trends in Mobile Malware
- Nature of Threats: While there has been a decline in mobile malware installers and ransomware, there has been an increase of banking Trojans. To ensure wider spread of malware and make the detection and prevention of the attacks harder, malicious actors use legitimate platforms like official marketplaces and widely-used apps to attack users’ devices.
- Traditional vs. Mobile Platforms: Although mobile threats are rising, traditional computing platforms like Windows still remain the primary targets for cybercriminals. To give you a simple example, we will mention that the number of blocked mobile attacks has reached more than 20 million. Meanwhile the number of cyber attacks that have been blocked on regular platforms is 20 times higher.
The Need for Enhanced Mobile Security
Even though traditional computing systems are still the predominant targets of cyber attacks, we should not neglect the mobile threats. With mobile devices getting more integrated in both personal and professional spheres, addressing their security vulnerabilities is extremely important.
“No matter if they are corporate-owned or part of a BYOD strategy, the need to implement appropriate security controls, and educate end-users about potential threats, is critical,”
states Mr. Keating, SVP at mobile security company, Zimperium.
In summary, while Android is a platform offering great flexibility and an ecosystem hosting a wide range of apps, these are also some key gateways to increasing cyber attacks towards Android users. As the line between mobile integration in the business world and personal life gets blurrier, stringent mobile security tools and measurements have become a necessity.
Mobile Security: A Critical Frontier in Cyber Defense
Amidst the surge of mobile device usage, experts like Mr. Keating from Zimperium emphasize the imperative need for robust security controls and user education to shield against escalating mobile cyber threats.
Revenue Generated from the Android Ecosystem
In today’s world where connectivity is highly cherished, the smartphone industry is one of the most lucrative markets, and Android has established itself as one of the pillars of the mobile industry. Given the vast reach and potential of Android, understanding its economic model is critical.

Growth Dynamics
| Growth Comparison (2015-2021) | ||
|---|---|---|
| Metric | iOS CAGR | Android CAGR |
| Hardware Revenues | – | 4% |
| Service Revenues | 23% | 12% |
It’s evident that while smartphone hardware sales enjoy a steady growth, the service revenues, especially income generated from iOS platforms, have increased exponentially. The current trajectory suggests that by 2028-30, Apple’s service revenues might surpass their hardware revenues.
App Store Revenues
One substantial source of income for iOS has been the non-app store revenue, which surpassed the whopping $1,200 per year. This revenue has been generated with the help of Apple’s extensive line of services like Apple Music, TV+, iCloud, and more. In contrast, Android has been focusing mainly on ads, with the platform offering a somewhat fragmented service environment rather than a unified ecosystem.
The Android Challenge
- Fragmentation: Different Android OEMs have been creating their own ecosystems, diverting from the unified ecosystem model of Apple.
- Community: Android users are unable to form a global and dedicated community. Meanwhile, a show like ‘Ted Lasso’ created a unique bond among Apple users, a phenomenon rare in the Android space.
- Clarity and Consistency: Android services often overlap, leading to confusion. Apple’s approach is to simplify its products and services and ensure smooth integration so that users can enjoy a seamless experience.
Google’s Android Revenue Model
Google may not have a direct hardware advantage like Apple, but it has introduced various innovations that would still earn the platform enough monetization:
- Play Store: This remains the most direct revenue source, with Google taking a cut of 15-30% on every transaction.
- In-App Purchases and Subscriptions: Google also profits from in-app transactions and subscriptions, even for third-party services.
- Ads and Analytics: Free apps, though not directly profitable, still generate revenue. Many use Google services for in-app ads and analytics.
| Google’s Earnings from “Services” | |
|---|---|
| Year | Revenue from “Google Services” |
| Q1 2022 | $6.8 billion |
Since Google has adopted an integrated model of revenue reports, it is quite challenging to estimate the revenue that has been generated strictly from the platform of Android. An Oracle litigation in 2016 hinted at Android’s profitability, estimating a revenue of $31 billion and a profit of $22 billion. However, this was almost a decade ago, and numbers have likely escalated since then.
Looking Ahead
While the enigma surrounding Android’s exact contribution to Google’s profits remains uncovered, one thing is certain: Android, directly and indirectly, is a significant revenue generator for Google. As the line between hardware and software blurs, and service-driven models become dominant, Android’s influence in Google’s revenue is predicted to continue its increase.
Key Takeaways:
- Services are outpacing hardware in terms of growth.
- Android’s service ecosystem remains fragmented and mainly focused on ads.
- Google’s Play Store is a dominant revenue generator, bringing in substantial profits from app sales and in-app transactions.
- The future of Android’s revenue generation lies in a unified service ecosystem.
Android Wearable Statistics
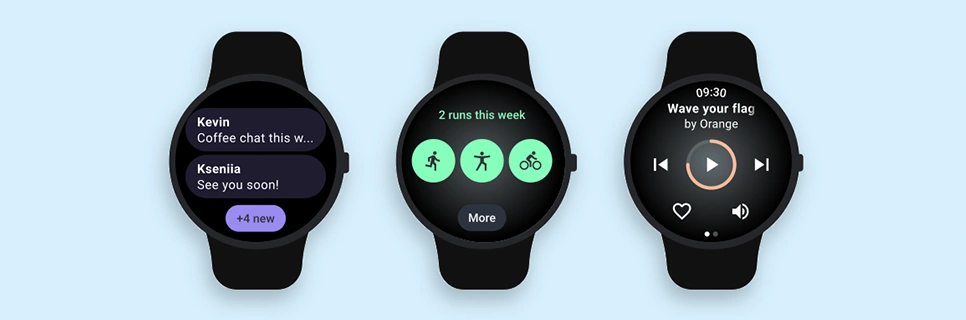
The realm of wearable technology has transformed our relationship with gadgets. From telling the time to tracking our heart rate, reading messages, and even monitoring the quality of our sleep, wearables have integrated themselves into our daily lives. And Android-run wearables have left a remarkable trace in this sector. Let’s explore this world through numbers and insights.
Market Dynamics: Android Wearables at a Glance
| Annual Smartwatch Market Share | ||||
|---|---|---|---|---|
| Year | Apple | Huawei | Samsung | Others |
| 2019 | 44% | 11% | 10% | 35% |
| 2020 | 43% | 8% | 9% | 40% |
| 2021 | 43% | 7% | 8% | 42% |
Highlights:
- The global smartwatch market was valued at $20.64 billion in 2019 and is projected to soar to $96.31 billion by 2027.
- Apple, which ranked as one of the big players in this sector, consistently held around 43% market share in shipments over the last three years.
- Huawei and Samsung battled for the second spot, with market shares of around 10%. Samsung’s share dipped slightly to 8%, while Huawei saw a marginal drop to 7%, with GSM restrictions being the main cause for the decline.
- Despite facing challenges on the global scene, Huawei is gaining momentum in the Chinese market.
- Samsung’s consistency since 2018 suggests a loyal user base and effective strategy, despite the overall market’s dynamic nature.
Features Galore: What Makes Android Smartwatches Tick?
- Health and Fitness: From heart rate monitoring to step counting, sleep analysis and tracking of stress levels, these watches are like personal health assistants attached to your wrist.
- Connectivity: Receive calls, texts, and app notifications, ensuring you’re always connected, even when you are not holding your phone.
- Apps & Customization: With Google Play Store access, users can download apps directly to the watch. Customization of watch skins is also available, allowing users to match the watch interface to their style or mood.
- Integrated Google Services: Users have access to Google Assistant for voice commands, Google Maps for navigation, and many other Google services.
- Payment Systems: Some models come with NFC for contactless payments.
- Long Battery Life: Many Android watches boast extended battery life, ensuring you’re not reaching for the charger every night.
- Compatibility: While optimized for Android devices, many watches are also compatible with iOS, broadening their user base.
- Diverse Price Range: From budget-friendly smartwatches to luxury models, there’s something for everyone.
Diving Deeper: Popular Android Wearable Brands
- Samsung: With its Galaxy Watch series, Samsung emphasizes health features and extended battery life. Running on Tizen OS, they offer a smooth user experience and integration that ensures compatibility with Samsung smartphones.
- Huawei: Huawei’s Watch GT and Fit series are known for their sleek designs and impressive battery lives. They have implemented a heavy focus on health and fitness metrics into their smartwatches.
- Fossil: As a traditional watchmaker, Fossil brings classic design elements into the smartwatch world, combining elegance with modern tech features.
- Fitbit (now part of Google): While Fitbit products had started as fitness trackers, they’ve ventured into the smartwatch realm, offering consumers multiple health tracking features and long battery life.
- Others: Brands like TicWatch, Suunto, and Garmin also have a certain presence in the Android-based wearable sector, with each brand providing unique features.
The Android wearable sector, though trailing behind Apple in terms of market share, shows diversity in different handles like brand-inclusivity, features, and price ranges. As tech and fashion continue to intertwine, Android wearables are predicted to bring lots of excitement to their customers, with innovations being at the forefront. Whether you’re a fitness enthusiast, a tech aficionado, or just someone looking for a smart accessory, Android wearables have something to offer.
Android TV Statistics
As digital entertainment has gone through a huge transformation in the last few years, long gone are the days when the TV was a box for simple entertainment. Today’s smart TVs offer a blend of conventional TV watching, streaming, gaming, and plenty of other fun activities. Android TV is an active contributor to said evolution in the smart TV field. With its adaptive interface and expansive app ecosystem, it is redefining entertainment for households worldwide.
By The Numbers: Android TV’s App Ecosystem
| App Distribution on Google TV | |
|---|---|
| Aspect | Count/Details |
| Total Publishers | 5,328 |
| Free Apps Available | 7,586 |
| Paid Apps | 551 |
| Total Categories | 47 |
| Noteworthy Mention | Many free apps may have additional in-app purchases or require subscriptions. |
Highlights:
- Android TV’s widely inclusive ecosystem boasts over 5,300 publishers, a clear proof of its diverse content options.
- Google TV users are spoiled for choice with a staggering 7,586 free apps to choose from. In addition to quantity, the platform also focuses on the quality and diversity of apps.
- To add to the free-app experience, Google TV is also offering 551 premium apps that require a purchase.
- The apps fall under a wide range of 47 different categories. Whether you’re into fitness, news, entertainment, education, or gaming, Android TV has something to cater to every taste and interest.
Gaming on Android TV: A Paradigm Shift
Features & Offerings:
- Versatile Gaming: Catering to the preferences of different types of gamers, Android TV supports single-player, multi-player, online, and offline gaming experiences.
- Multiple Controllers: Players can make the multiplayer gaming mode even more exciting by connecting up to four gamepads, Android phones, or tablets simultaneously.
- Seamless Experience with Google Play Games: Switching devices? No worries! The Google Play Games’ progress-saving feature allows you to start a game on your Android phone and pick up right where you left off on your TV.
Growing Trends in Android TV Usage:
- Integrated Voice Assistants: With the integration of the Google Assistant feature, users can use voice commands to control their TV, search for content, or even manage smart home devices.
- 4K and HDR: As there is an increasing amount of 4K and HDR content, Android TV devices, which support these functions are gaining more popularity.
- Crossover with Streaming Services: As Android TV has been integrated with popular streaming services like Netflix, Amazon Prime Video, and Disney+, the service has become the number one choice of people who enjoy binge-watching.
- Enhanced Connectivity: Android TV devices often come with Chromecast built-in, allowing users to cast content directly from their mobile devices or computers.
Android TV has established a significant niche in the smart TV field, which led to its inevitable and continuous growth. With Android TV’s focus on user experience, the app ecosystem that constantly increases, and features that fit the lifestyle of modern users, the smart TV platform is bound to dominate living rooms in the upcoming years. As more publishers and app developers recognize its potential, it is expected that plenty of new, innovative, and entertaining apps will be added to the platform.
Android vs iOS: The Evergreen Debate
Mobile operating systems have a massive contribution to the change in digital consumption. There has been an ongoing competition between Android and iOS, with both platforms determining the way users interact with their devices, apps, and the entire ecosystem of services and gadgets they might be using. Here’s a comparative look into their market dynamics:
Key Takeaways from Market Dynamics:
- Global Supremacy: On a global scale, Android is the platform with a bigger influence among users due to its broader range of devices, affordability, and the support of Google. In contrast, due to iOS’s elite appeal, the platform is more popular in niche markets, especially in economically strong countries.
- User Base: The combined number of users that have adopted the use of Android and iOS devices exceeds 6 billion users worldwide. This strong duo has maintained a monopoly over the mobile market, giving no other contenders the chance to enter the scene.
Device-Based Market Shares:
| Mobile OS Market Share (Worldwide) | |||
|---|---|---|---|
| Device Type | Android (%) | iOS (%) | Others (%) |
| Mobile Phones | 69.74 | 29.58 | <1 |
| Tablets | 44.91 | 54.85 | <1 |
| All Devices Combined | 37.66 | 16.63 | 45.71 |
Highlights:
- Android’s dominance in the mobile phone manufacturing sector is undeniable, holding almost 70% of the global market.
- Thanks to Apple’s iPad products, In the tablet sector, iOS is holding dominance over Android.
- When considering all types of devices, Android and iOS hold a combined market share of over 50%. While Android has the biggest market share in the device sector, Windows OS comes a close second.
User & Vendor Landscape:
- Users: On a global scale, there are around 3.5 billion Android users and 1.3 billion users who use iOS-based devices. Considering the annual smartphone sales, these user base numbers are projected to grow even more.
- Vendors: While iOS is exclusively implemented with devices in the Apple ecosystem, Android’s open-source model allows various global manufacturers to pick the OS for their products. Samsung has been a frontrunner when it comes to Android devices, but Chinese manufacturers like Xiaomi, Huawei, Oppo, and Vivo are also significant contributors, holding over 55% of the Android market.
Revenue Dynamics:
Despite the huge Android user base, iOS beats Android in app-based revenue. In 2022, of the $167 billion earned from mobile apps, iOS’s contribution surpassed 50%, while Android apps contributed 27% to the total earnings. Based on this stark difference, we can conclude that while Android enjoys a vast variety in the mobile device sector, Apple’s user base is more dedicated to the brand and is willing to spend more.
Location-Based Market Preferences:
| Android vs iOS in Select Countries | ||
|---|---|---|
| Country | Android (%) | iOS (%) |
| Global | 69.74 | 29.58 |
| USA | 43.12 | 56.44 |
| UK | 48.1 | 51.38 |
| Canada | 40.89 | 58.51 |
| India | 95.33 | 3.94 |
Insights:
- iOS tends to have a stronger presence in developed countries like the USA, UK, and Canada.
- Android is significantly more popular in countries like India, mainly due to the cost associated with Apple devices.
There are multiple factors to consider when we are comparing Android to iOS. While Android enjoys a broad user base and device availability, iOS thrives on exclusivity, premium user experience, and a loyal fanbase. As technology evolves, the dynamics between these giants will keep changing, which makes the mobile industry a sector that is worth observing in the upcoming years.
Conclusion: Android and iOS – The Titans of the Tech World
The digital era has been marked by the unstoppable rise of mobile devices, particularly smartphones. There are two major operating systems that have a massive contribution to the said rise – Android and iOS. Their story, dynamics, and trajectory give us a great narrative, showing us how far we have come when mobile technology is concerned as well as where the future might take us.
Key Takeaways:
- Android’s Power Play: With its unmatched global outreach, Android stands out as a leader in the mobile operating system industry. The platform’s strong points include:
- Open-Source Flexibility: Offering a customizable platform for developers and manufacturers.
- App Ecosystem: Am expanding and diverse app marketplace that caters to different users’ needs.
- Device Versatility: From budget-friendly phone options to flagship devices, Android’s price ranges cannot be matched.
- As Android relentlessly pushes its boundaries, the future holds nothing but more innovations and improved user experience.
- iOS’s Premium Appeal: While Android’s presence in the market is impressive, iOS continues to show great results, with its exclusivity and elite ecosystem:
- User Loyalty: Rather than simply offering devices in a unified ecosystem, Apple strives to offer a seamless user experience, which has contributed to the brand’s dedicated user base.
- Revenue Dynamics: Despite having fewer users, thanks to their dedication to the brand, Apple is consistently surpassing Android’s app-store revenue.
- As Apple continues to place focus on privacy, user-friendly design, and innovative offerings, we are carefully watching if it will manage to beat Android’s dominance in the global user base sector.
Your Voice Matters:
Stay Updated with Us:
If this deep dive into the Android and iOS universe piqued your interest, you will enjoy the abundance of information you can find on our website, including different insights, updates, and analyses. Make sure to stay updated about the newest innovations in the tech industry by browsing through our latest articles.
Explore the Latest in Tech: Stay Informed with Our Insights
Dive into the dynamic realm of technology with our comprehensive articles, and stay ahead of the curve in the ever-evolving Android and iOS ecosystems.
In the evolving tech world, staying informed allows users to make the most of the devices and gadgets that are shaping our daily lives. Whether you’re Team Android, Team iOS, or somewhere in between, there’s always something new to discover. Happy exploring!